Matplotlib-折线图
创始人
2025-06-01 11:04:15
0次
import matplotlib.pyplot as plt# 创建x轴数据
x=[10,20,30,40,50]
x_1 = [24,48,168,336,720]
# 创建y轴数据
y=[0,1,2,3]
y_1 = [0,1,2,3]# 创建y轴数据
y1 = [0.05, 0.09, 0.15, 0.25,0.45]#FECAM
y2 = [0.05, 0.075, 0.21, 0.27,0.52]#LSTM
y3 = [0.05, 0.07, 0.12, 0.22, 0.41]#LSTnet
y4 = [0.23, 0.47, 0.52, 0.7, 2.7]#informer
y5 = [0.35, 0.53, 0.67, 0.92, 3.2]#logtrans
y6 = [0.23*(2/3), 0.47*(2/3), 0.52*(2/3), 0.7*(2/3), 2.7*(2/3)]#Autoformer
# y7 = [1, 3, 6, 9, 13]
# 绘制折线图
plt.plot(x, y1, 'rs--', label='FECAM-mlp')
plt.plot(x, y2, 'bo--', label='LSTM')
plt.plot(x, y3, 'cd--', label='LSTnet')
plt.plot(x, y4, 'gx--', label='Informer')
plt.plot(x, y5, 'm*--', label='Logtrans')
plt.plot(x, y6, 'kx--', label='Autoformer')
# plt.plot(x, y7, 'kp--', label='Line 7')# 设置图例
plt.legend(loc='upper left')
# 设置x轴刻度
plt.xticks(x, x_1)
# 设置y轴刻度
plt.yticks(y, y_1)
# 设置坐标轴标签
plt.xlabel('X-axis')
plt.ylabel('Y-axis')
# 设置坐标轴标签
plt.xlabel('Input length')
plt.ylabel('Train time (Hour)')
# plt.xlim([0,3])
plt.ylim([0,3])
# 设置标题
plt.title('Analysis of Training Time for Different Input Lengths')
plt.savefig("Training time.png", dpi=300)
# 显示图表
plt.show()
import matplotlib.pyplot as plt# 创建x轴数据
x=[10,20,30,40,50]
x_1 = [24,48,168,336,720]
# 创建y轴数据
y=[0,1,2,3,4,5,6,7,8]
y_1 = [0,1,2,3,4,5,6,7,8]# 创建y轴数据
y1 = [0.05, 0.07, 0.09, 0.12,0.17]#FECAM
y2 = [0.09, 0.2, 0.6, 1.8,3.5]#LSTM
y3 = [0.2, 0.5, 2.3, 4, 9.8]#LSTnet
y4 = [0.12, 0.19, 0.25, 0.32, 0.35]#informer
y5 = [0.15, 0.22, 0.27, 0.34, 0.36]#logtrans
y6 = [0.15*(2/3), 0.22*(2/3),0.27*(2/3), 0.34*(2/3), 0.36*(2/3)]#Autoformer
# y7 = [1, 3, 6, 9, 13]
# 绘制折线图
plt.plot(x, y1, 'rs--', label='FECAM-mlp')
plt.plot(x, y2, 'bo--', label='LSTM')
plt.plot(x, y3, 'cd--', label='LSTnet')
plt.plot(x, y4, 'gx--', label='Informer')
plt.plot(x, y5, 'm*--', label='Logtrans')
plt.plot(x, y6, 'kx--', label='Autoformer')
# plt.plot(x, y7, 'kp--', label='Line 7')# 设置图例
plt.legend(loc='upper left')
# 设置x轴刻度
plt.xticks(x, x_1)
# 设置y轴刻度
plt.yticks(y, y_1)
# 设置坐标轴标签
plt.xlabel('X-axis')
plt.ylabel('Y-axis')
# 设置坐标轴标签
plt.xlabel('Predict length')
plt.ylabel('Inference time (Second)')
# 限制 x 轴的范围在 [2, 8],y 轴的范围在 [-1.2, 1.2]
# plt.xlim([0,3])
plt.ylim([0, 8])
# 设置标题
plt.title('Analysis of Inference Time for Different Prediction Lengths')
plt.savefig("Inference time.png", dpi=300)
# 显示图表
plt.show()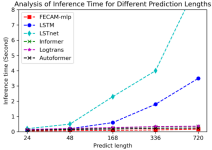
相关内容
热门资讯
暴涨的中国卫星,彻底“引爆”A...
A股,总是让人捉摸不定。商业航天股暴涨,政策大力支持正当人们以为“易中天”为代表的AI硬件依然是市场...
19.5亿买一张“赶海船票”,...
导语:以规模制造、成本控制见长的风电装备企业进入海工体系,面临挑战呈几何指数级增长。“赶海”大潮,正...
巴奴成不了海底捞
作者| 张帆 黄绎达编辑|黄绎达封面来源|视觉中国巴奴火锅在今年6月首次递表后,证监会在8月就公司运...
金融壹账通退市背后:模式拐点已...
2025年末,曾被市场视为“中国金融科技第一股”的金融壹账通,正式完成美股、港股私有化退市,为其六年...
怒江峡谷的“逆行者”:用“抵达...
横跨怒江上的溜索,现在还有人用吗?怒江州山区面积逾98%,天然形成“四山夹三江”的高山峡谷地貌,曾经...
上交所发布商业火箭企业适用科创...
新京报贝壳财经讯 12月25日,为了贯彻落实中国证监会《关于在科创板设置科创成长层 增强制度包容性适...
“果链”巨头市值1100 亿,...
文 | 张佳儒提起“果链”巨头,立讯精密、蓝思科技的名字总被反复提及,王来春、周群飞的创业故事也早已...
对话欧莱雅:“变”与“不变”之...
当“合成生物”重塑了造物的逻辑,当“数智技术”带来了体验的革新……美妆价值链上科技应用的重要性在日益...
砸千亿支持硬科技,首批区域基金...
本文来源:时代周报 作者:阿力米热千亿级创投活水来了。国家发展改革委、财政部发起设立的国家创业投资引...
2025年A股IPO收官:11...
2025年即将收官,A股IPO(首次公开募股)格局初定。截至12月26日,2025年A股发行上市家数...